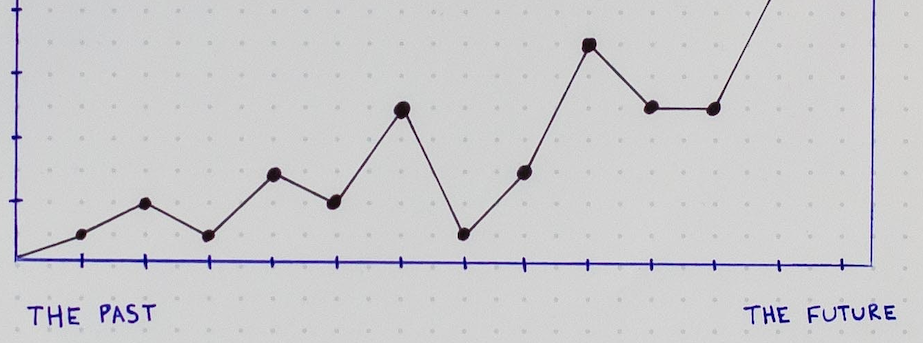
It all starts with a question
What does a good _______ look like?
That question can be applied to anything:
- What does a good movie look like?
- What does a good diet look like?
- What does good art look like?
In this article, I’ll explore one of the most frequent questions I’m asked: what does a good digital experience look like?.
Let’s start by making things less subjective
The challenge to this question is that most of the answers to it become highly subjective to the individual that you are asking.
So, to get more objective in this, we’ll want to break down we need to break the conversation into quantitative and qualitative data points:
Quantitative: relies upon numerical or measurable data.
Qualitative: relies upon personal accounts to illustrate how people think or respond
Now, let’s apply that to movies
In the film industry, for many years the what does a good movie look like? question was broken down by metrics such as:
- Quantitative: Box office results
- Qualitative: Critic movie reviews and recommendations from friends
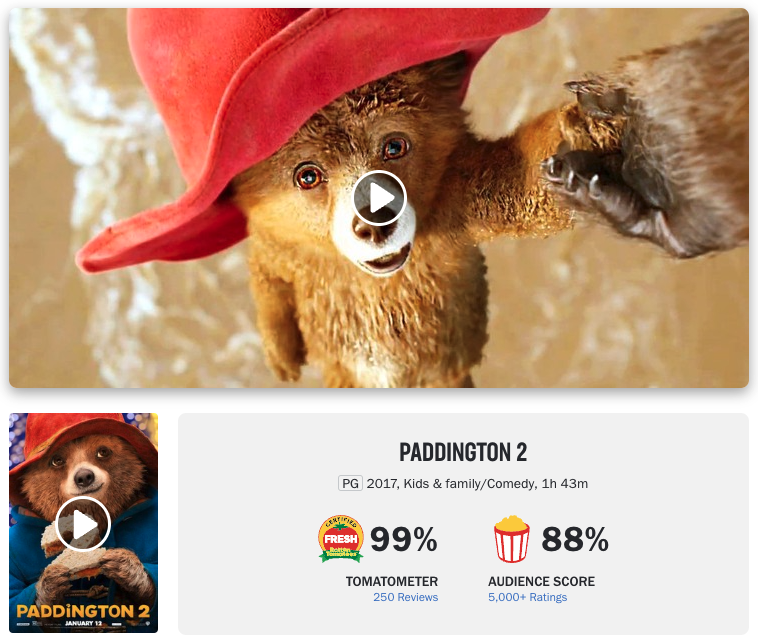
Then, in 1998 Senh Duong created Rotten Tomatoes, which attempted to quantify the qualitative through the Tomatometer as a measure of film quality through film critic ratings and other data points. Later, they introduce audience scores based on viewer ratings.
While there will always be debate if you as an individual agree with this value (based on our own subjective take) and others might debate on the method of calculating the metric. One thing is for sure, these metrics have made it more approachable to quantify what makes a movie good.
How else would I have come to find out that Paddington 2 is one of the highest-rated movies out there? Because this number was able to show me that there was quantification in the movie, I used it to decide to watch the movie. To my surprise, it was a wonderful movie and I agree with the rating.
How does that apply to digital experiences?
In the digital world, there is no shortage of what companies might look at benchmarks for customers, such as CSAT (based on customer service and product quality feedback), Customer Lifetime Value (the total worth to a business of a customer over the whole period of their relationship).
However, when it comes to an actual user’s experience on a web or mobile experience, it can be incredibly challenging to rally a team around specific numbers because they are valued differently across brand, marketing, analytics, design, and technology teams.
All teams would of course agree that having more users visit a website and purchase a product. But, if there was a sudden decrease in revenue due to a drop off in user checkouts from analytics data…
-
Marketing teams might hypothesize that lack of personalization is the reason that users abandon the experience and show examples of what Amazon might do
-
Design teams might hypothesize that poor layout or imagery is the reason that users abandon the experience and reference an example from a different business, layout, and objective
-
Technology teams might hypothesize that slow page performance is the reason that users abandon the experience and recommend that they re-architect the website
They could be right or wrong, but the challenge is that they are using a subjective perspective to treat symptoms as opposed to the cause of decreased revenue.
The Path Forward: Benchmarks
Using the example of movies, the Tomatometer helped break through subjective reviews and a million data points by creating a benchmark for movies. Allowing us to decide to watch or not watch a movie based on a comparison of a score sourced from several data points.
Applying this to digital experiences, we need to focus on Digital Benchmarks, which I’ll define as:
A score generated from real data points that can help that help make a decision through direct comparison.
Furthermore, for teams to be aligned on these benchmarks, each benchmark must be:
1. Applicable: Teams should be able to understand the value of the benchmark and apply it to their individual skillsets.
2. Actionable: Teams should be able to act upon the metrics with clear steps within their individual teams.
3. Analogous: Teams should be able to be compared to direct and indirect competitors to determine how to improve, innovate, and differentiate
So…what are good benchmarks?
Unfortunately, there is not a Tomatometer score for web and mobile experiences.
However, there are very clear patterns that have been the backbone of digital experiences for years that we can use as our initial foundation. I will talk more about these in a follow-up post.
In the meantime, I’ve laid out a construct for benchmarks that you can use as a framework for your next large redesign, development, or operation of your digital experience.