My name is Tim and I’m addicted to Netflix. It’s something I love to do while I’m working at home, relaxing after a long day, or just decompressing over the weekend. I’ve noticed a trend of heavy usage lately, so I did what any normal person would do in this situation and I wrote a script to scrape, inspect, and analyze my Netflix viewing history.
Background
Very early in my startup career, my business partner Jostin and I used to watch movies nonstop while we worked. It was a way of allowing us to “get in the zone”, but also have something entertaining in the background that is more engaging than music. In one of our studios, we actually had a projector mounted just so that we could work and watch movies in a theater style environment. Pretty cool right?

I’ve been using Netflix for a number of years and wanted to see what that viewing history really looked like.
I have a decent amount of experience doing screen scraping, so I knew coming into it, it wouldn’t be as easy as just scraping data and spiting out numbers. My goal with this program is to:
- Find a place on Netflix where I can scrape all of my viewing history
- Capture as much information on each program that I can
- Calculate a time series data set where I can calculate minutes viewed per day
- Perform some analysis on genre, type of view (movie or tv show), and whatever else I can get access to
- Deal with any challenges that come up on the way.
Let’s walk through how I battled through it.
Step 1: Scrape Viewing History
To get started, I need to find a place I watch Netflix like a fiend, so I was hoping that somewhere they would have a record of all of my viewing history. After a bit of searching through Netflix’s account portal, I was able to find a Viewing history page.
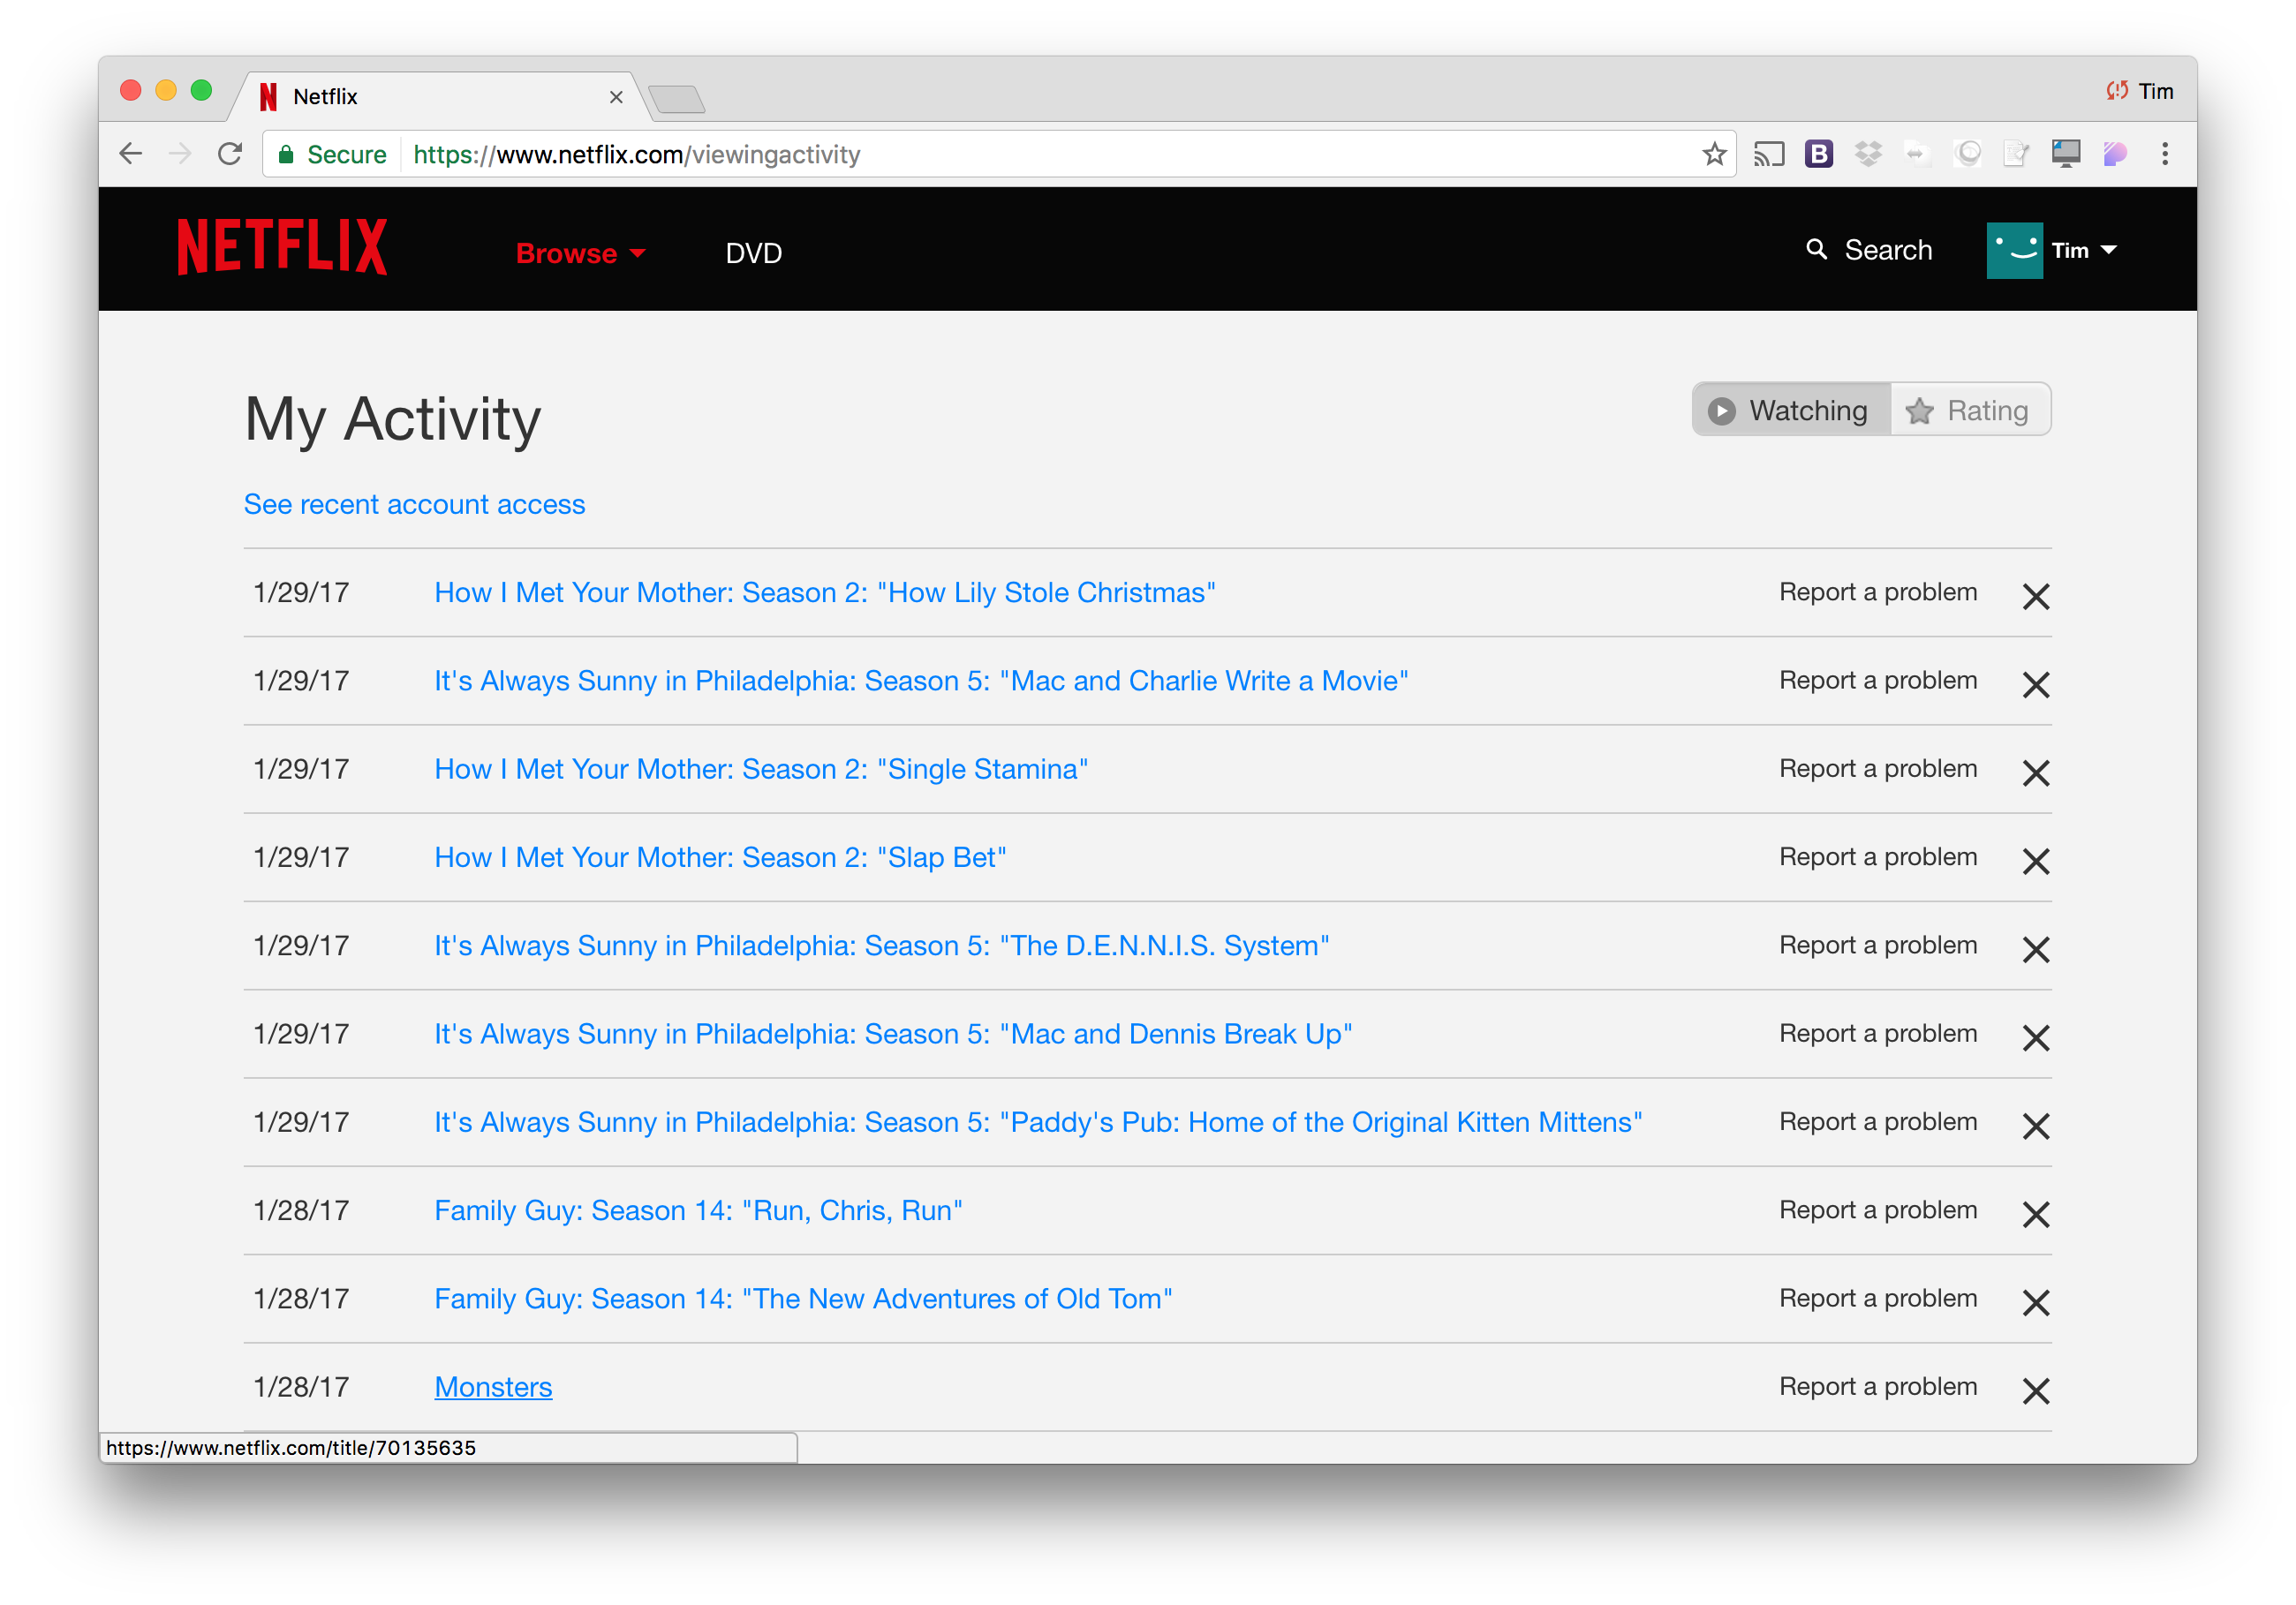
Exactly what I wanted! I have a date, title, and hyperlink which gives me access to the direct URL of the title which contains the unique id of the Netflix program.
I was doing this as a passion project, so didn’t want to get too deep into the weeds on technology or setup, so I used Nokogiri with the help of good old Apple Script. This means that this solution will only operate on Mac OSX.
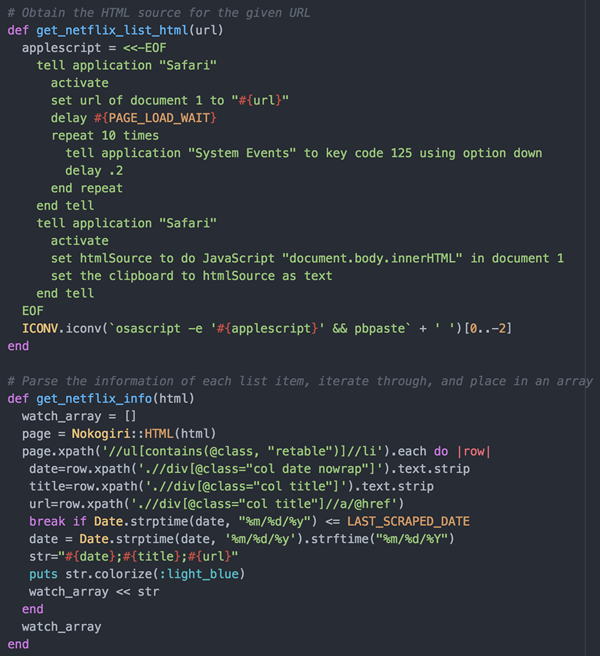
This script uses AppleScript to open Safari to the viewing history page and exposing it as a string for me to parse and process. Once I had this initial code written, I ran into Gotcha #1. This page is an infinite scroll web page meaning that we need to trigger it to load more entries by scrolling down instead of clicking on a button like “next”.
So once the viewing history page loads, the program will press the “down key” 10 times to load the past few days of viewing history. It’s worth noting that When I first ran this, I had to increase that number to about 5000 for it to go back a total of seven years. It took a LONG time.
Once all of the web content is loaded, I use XPath to loop through the HTML elements and save the values in HTML into variables in ruby so that I can save it to an array. I then save this array to a csv style format so that it can be further processed.
Now, let’s run it!
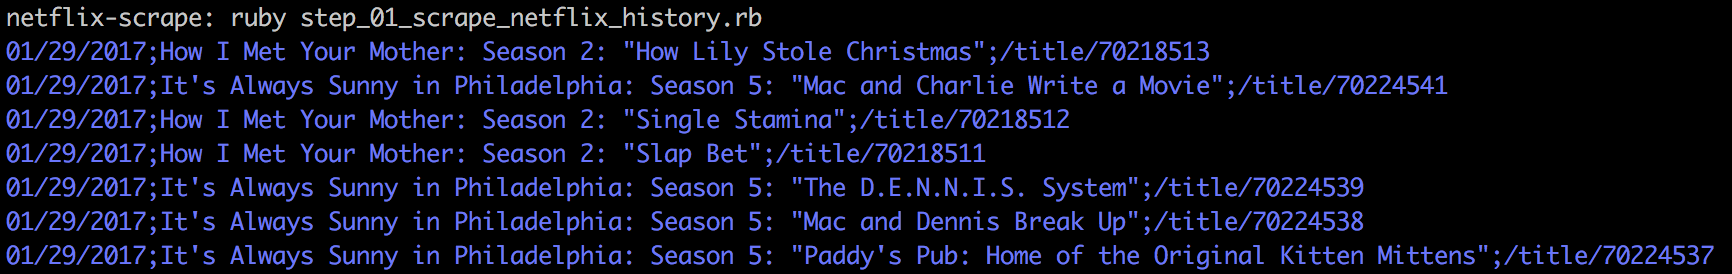
Awesome! We now have all of the raw data that we’d hope to get from the web page and we are saving it to a CSV file.
Being a kind web scraper #1: The first time I scraped, I took a while to collect the initial dump of data. For each scrape after, I’m minimizing the scrolling to cover about 2 weeks so that I’m not hitting Netflix’s server too much.
Step 2: Capturing Program Meta Data
At a base level, this data is great, but it doesn’t provide the information I really wanted to capture, such as duration or genre, so we need to dig deeper.
Gotcha #2: Netflix has wildly different displays for each series or movie. Check out a selection of the slightly different layouts that Netflix shows.
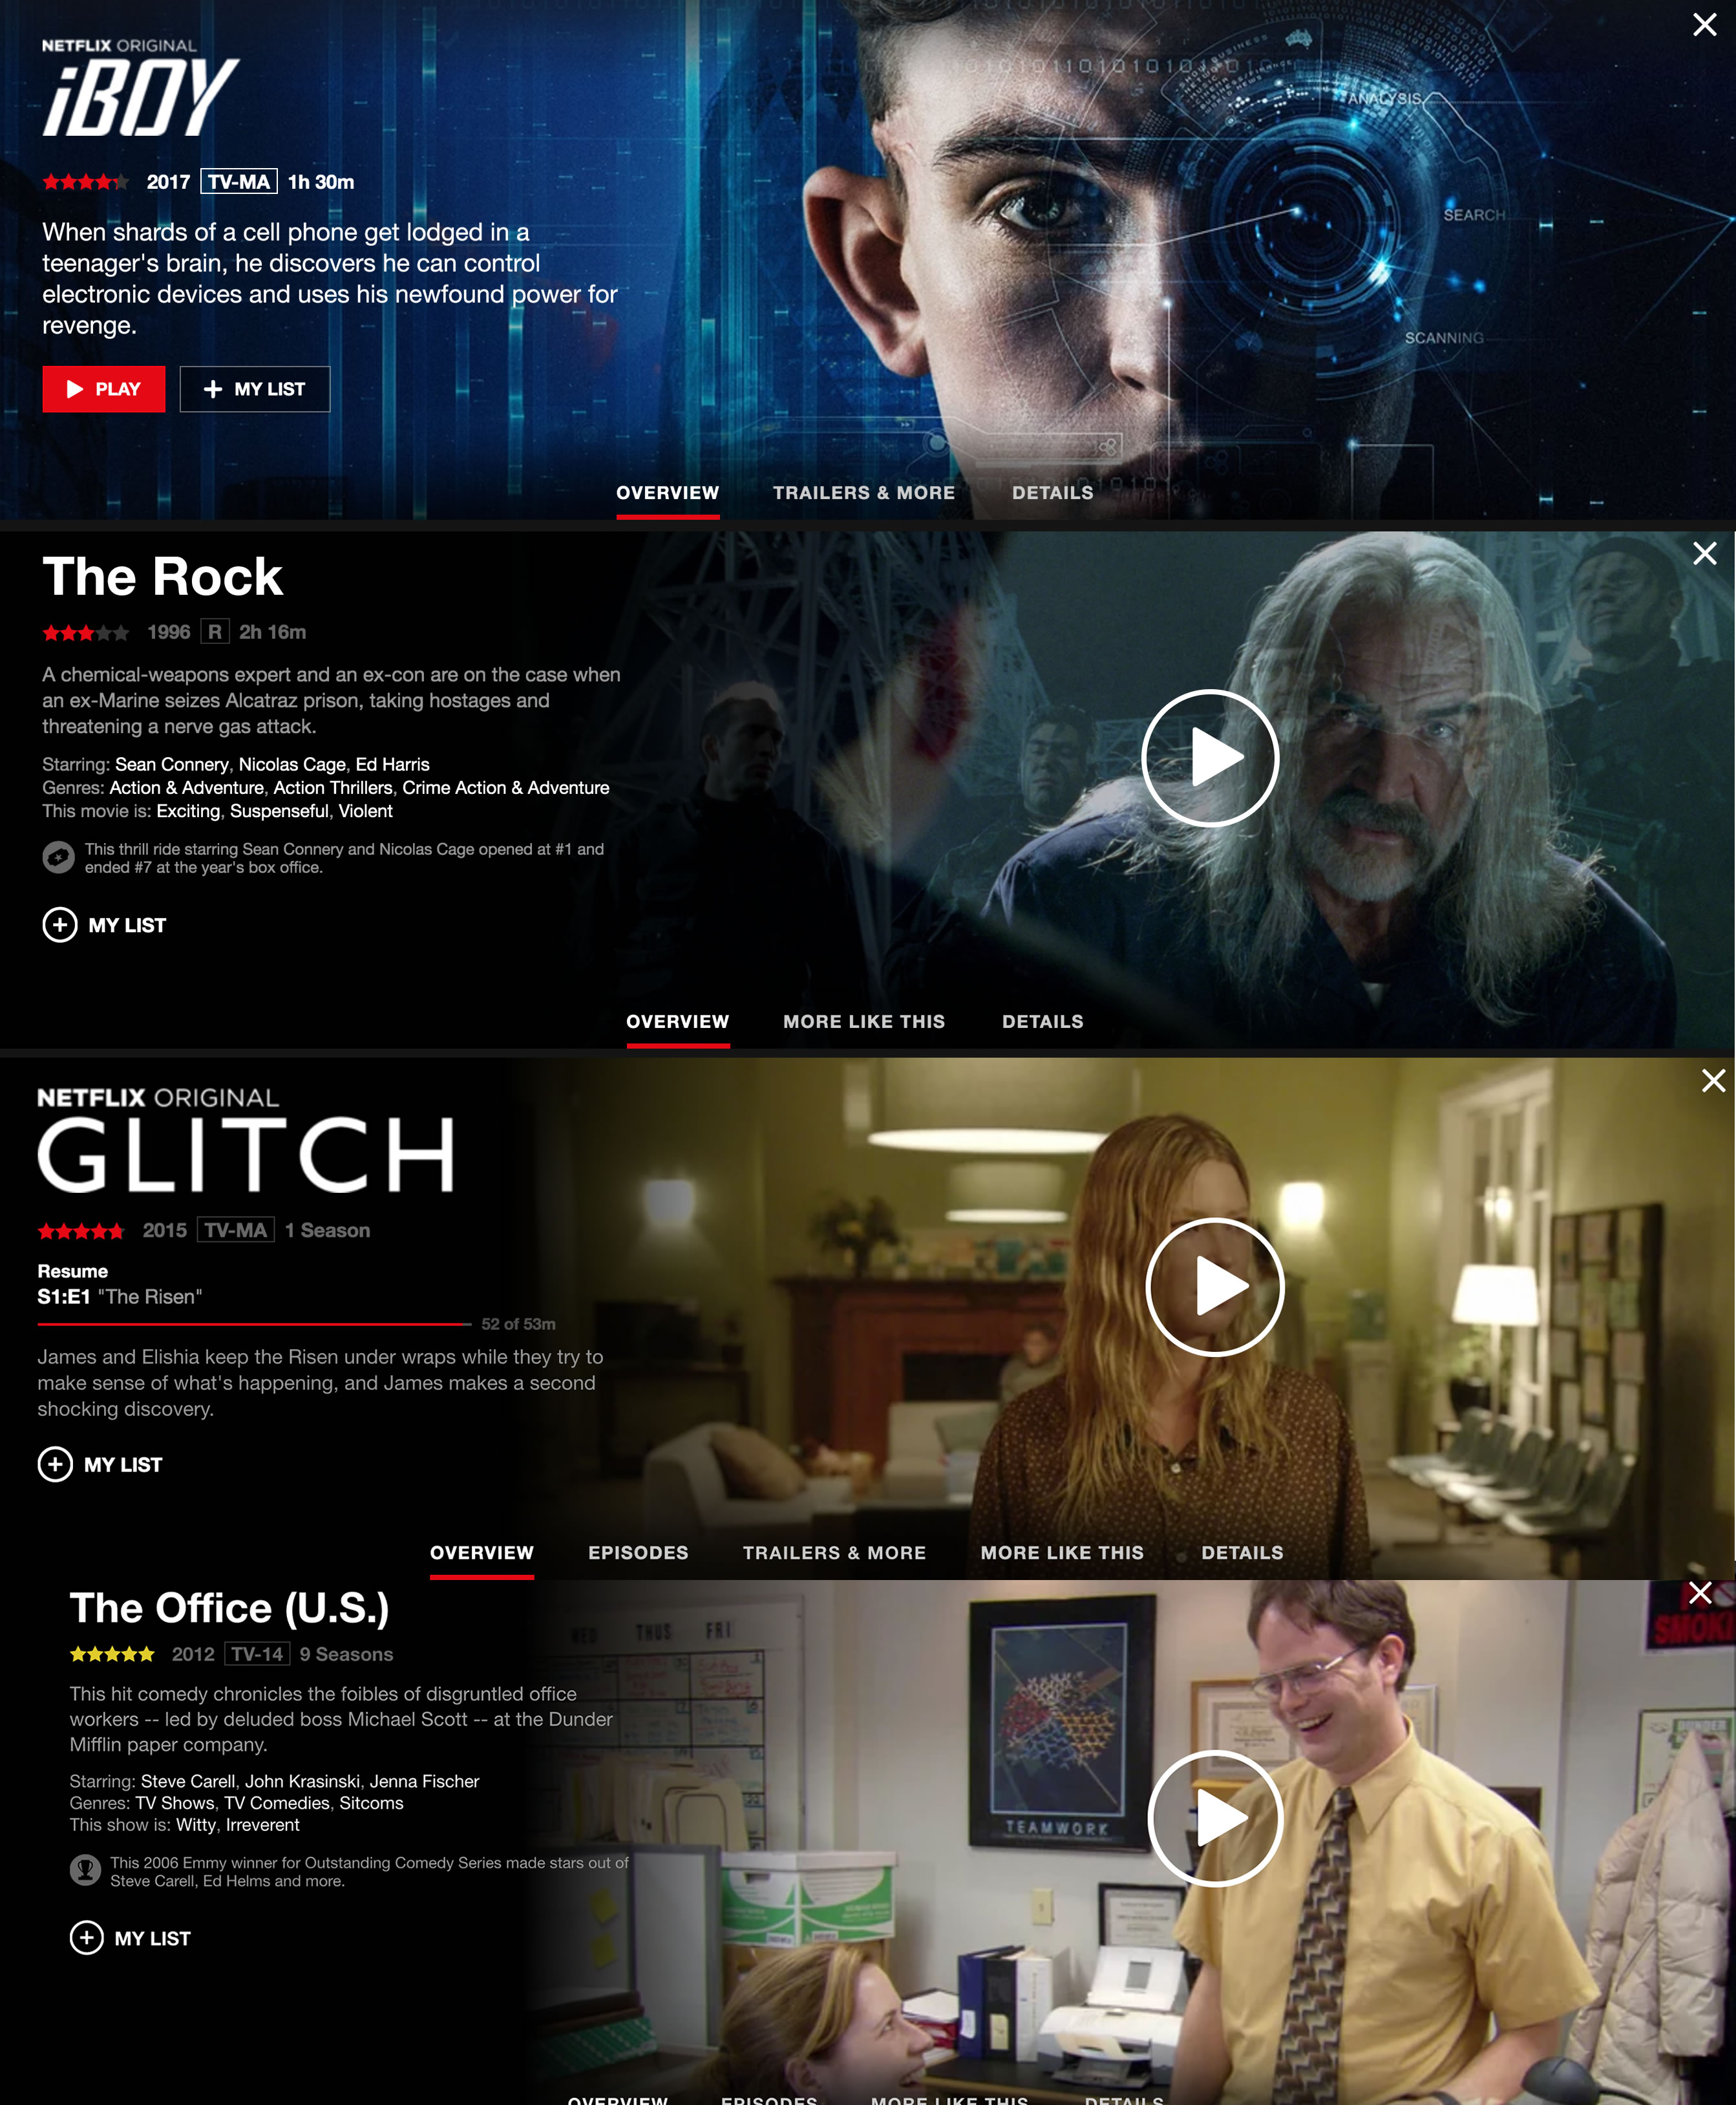
I tried writing a script to handle the variations, but the wide variety of layouts make it super difficult to scrape and even if I could get them consistently, it is missing a bit of key information without requiring some clicking around. Notice that in the “Glitch” and “The Office” examples that even though they are both TV shows, one is in the “resume” state which displays the number of minutes in the episodes, The Office view doesn’t display anything about duration.
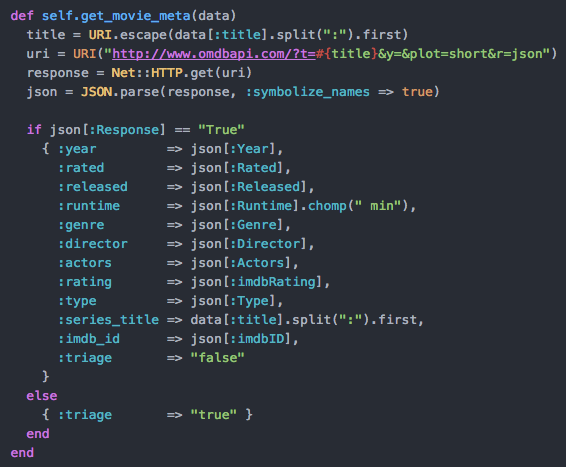
After a bit of digging trying to find a stable alternative, I discovered the OMDB API (https://www.omdbapi.com/), which provides a free api service alternative to IMDB. They have a simple API where I can pass in a movie or tv show title and receive an easily parseable response in JSON format.
Gotcha #3: You might notice in this query that I’m splitting the string on the first colon. This is because OMDB doesn’t know anything out individual episodes, so my removing the colon (which is the standard delimiter for Netflix), we could actually get the series information
Okay, let’s run this script.
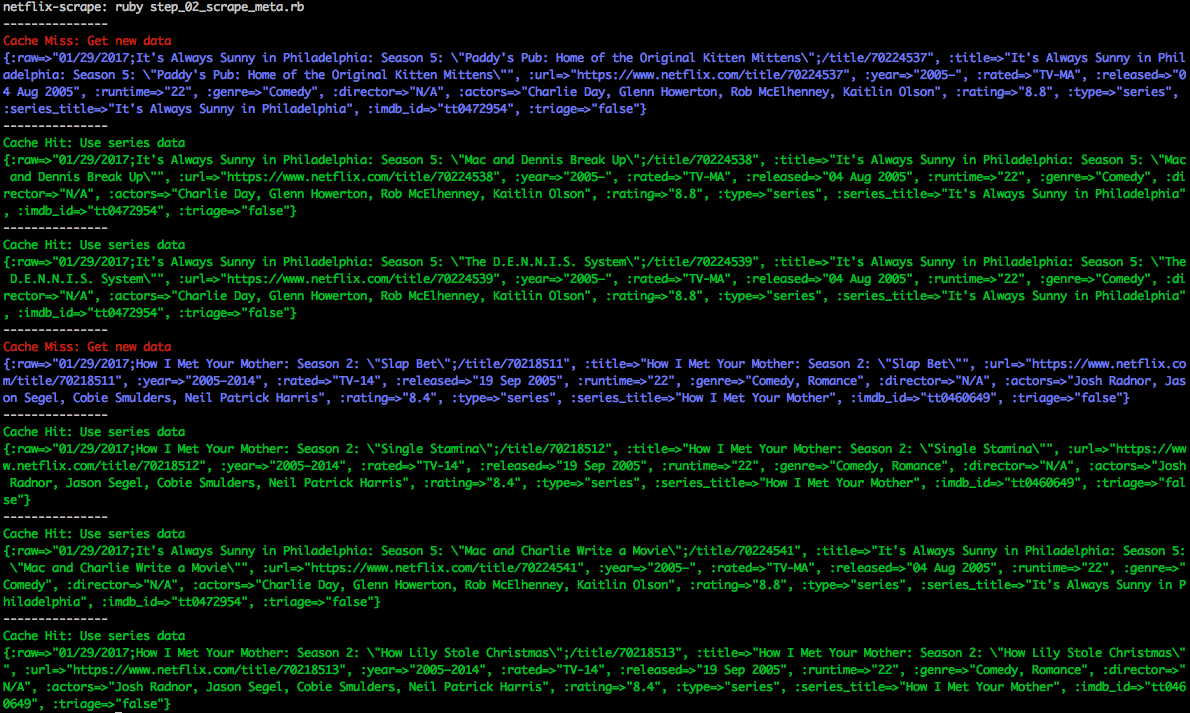
All of the results from this script are appended into a CSV file that will act as our “Master Data” file. With this data, we know have all kinds of great information such as the runtime, rating, release data, director, actors, IMDB Rating, and more.
Being a kind web scraper #2: I watch a lot of Netflix, so if I called this for every single item, it might get a bit intense on the OMDB servers. To make it a bit kinder on their system, I added a light cache so that whenever I watch a bunch of shows in a series, I would only have to call the API once. You’ll see that in the image about, while I watched a total of 7 things, it only actually had to hit the OMDB API twice.
Step 3: Remove Kids Stuff
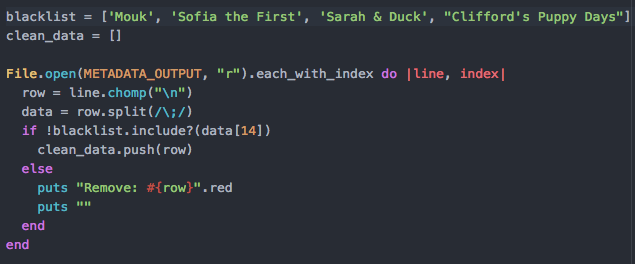
My daughter and niece both use my Netflix to view kids shows. I didn’t want to inflate my numbers by including their awesome tv shows, so I added a script for me to manually put in kids shows that I know and remove them from the list. I’ve also used this script to ignore a random show or two that someone else might watch on my account. I add to this list when I see new programs come through that I might want to clean up.
Step 4: Triage
I am now taking raw data that I’m scraping from netflix, then querying a seperate API…things are bound to go wrong sometimes. You might notice in the query image above that if the title isn’t found in the OMDB API, that I’m adding a triage flag.
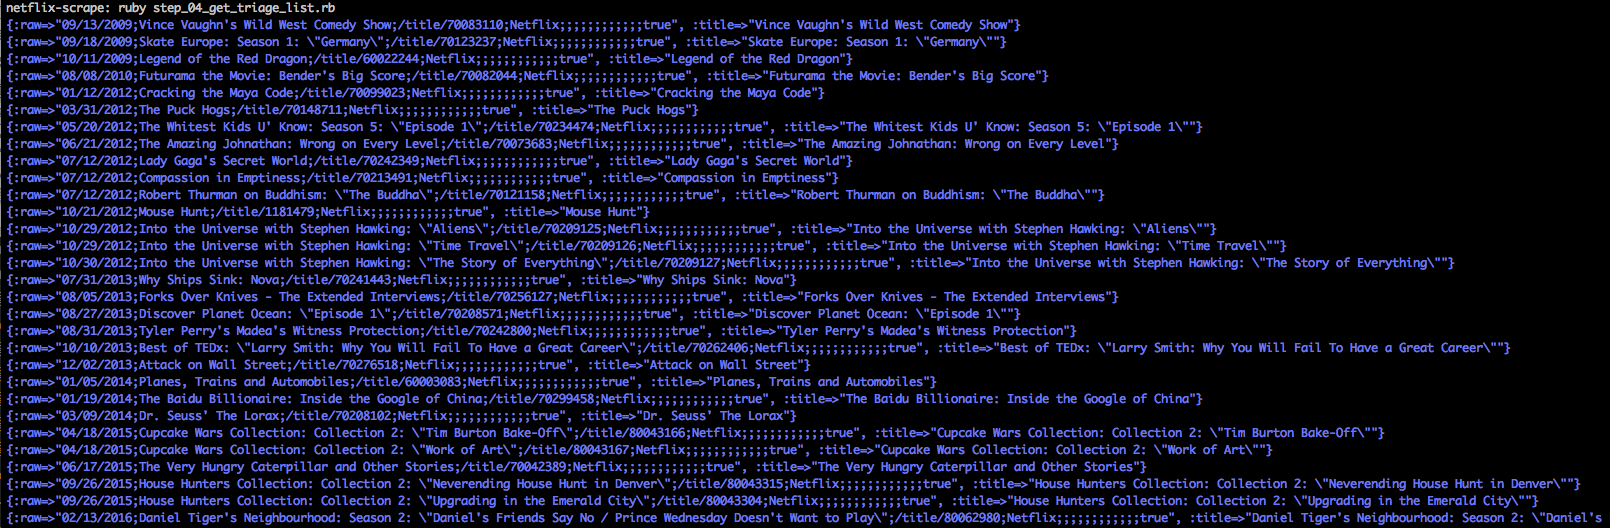
You’ll notice that when i run this script, a ton of random things show up. Often times I simply need to change a value so its more readable by OMDB. Other times its a Netflix only special or a kids show that isn’t observed. I take care of most of the bigger things, but a number of items hang around here because I don’t want to take the effort to look up each individual one. It’s okay if it stays in the data file, it’ll just be ignored when I perform calculations later in the process.
Step 5: Generate Time Series Data
Now that I have a relatively clean data set, I can run through all of the runtimes that I’ve pulled from OMDB. I wrote a script that would read in all of the rows of netflix watches into a hash, then I iterated each day from the first watch on netflix to the last watch. I would then add up the total minutes watch, hours watched, total number of shows vs movies so that I can have some fun with the data.
Finally, I have what I really wanted. I have a great time series of data saved to a coma seperated file and ready to be analyzed.
Step 6: Generate Metrics
But first, I wanted to run some quick metrics against the data and see if I can pull out some key of this addition :)
I wrote a script that would query the data in a variety of different ways, to give me a few indicators I could use.
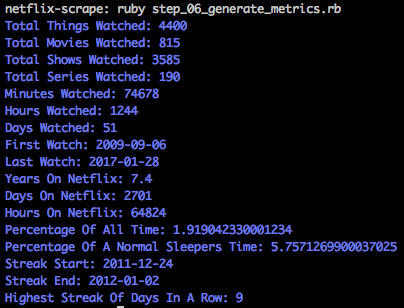
Woof. Okay, the gravity of my viewing history is dawning upon me…but I need graphs!
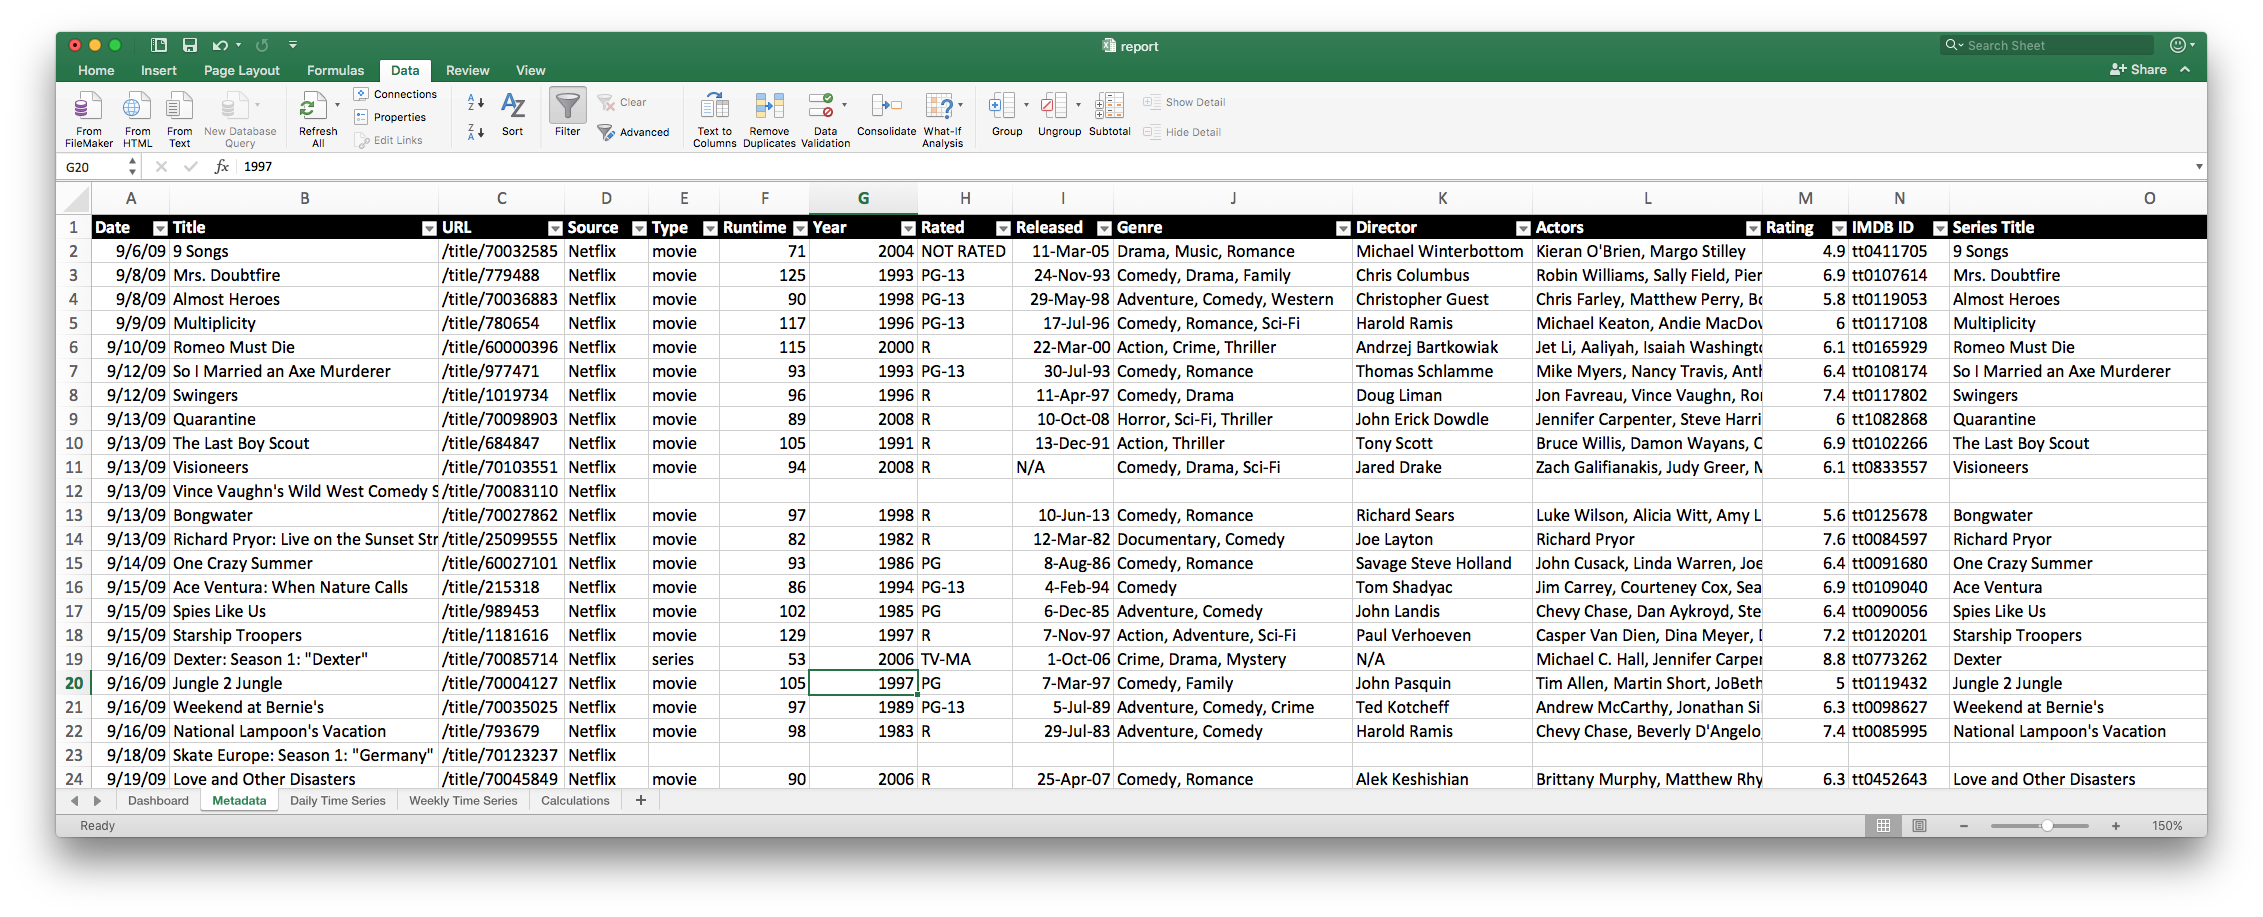
Step 7: Leverage The Power of Excel
Because I planned out all of this application to use CSV files, I can easily pull it into our good friend Excel. Excel is a power tool that can do just about anything and in this case, I’m going to use it to pull all of this information together to be something consumable.
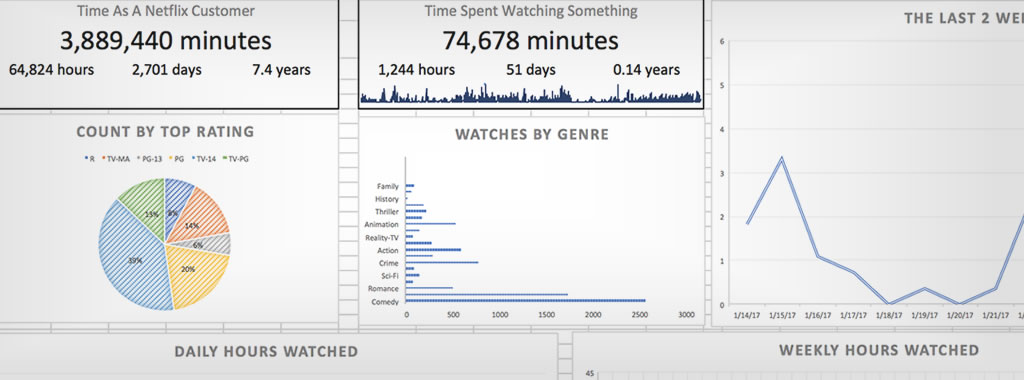
Master File: Starting with the metadata file that has all of the information of every single view, I can import that into Excel (mine is 5,500 rows long!) and do whatever I want with this data, from filtering to lookups.
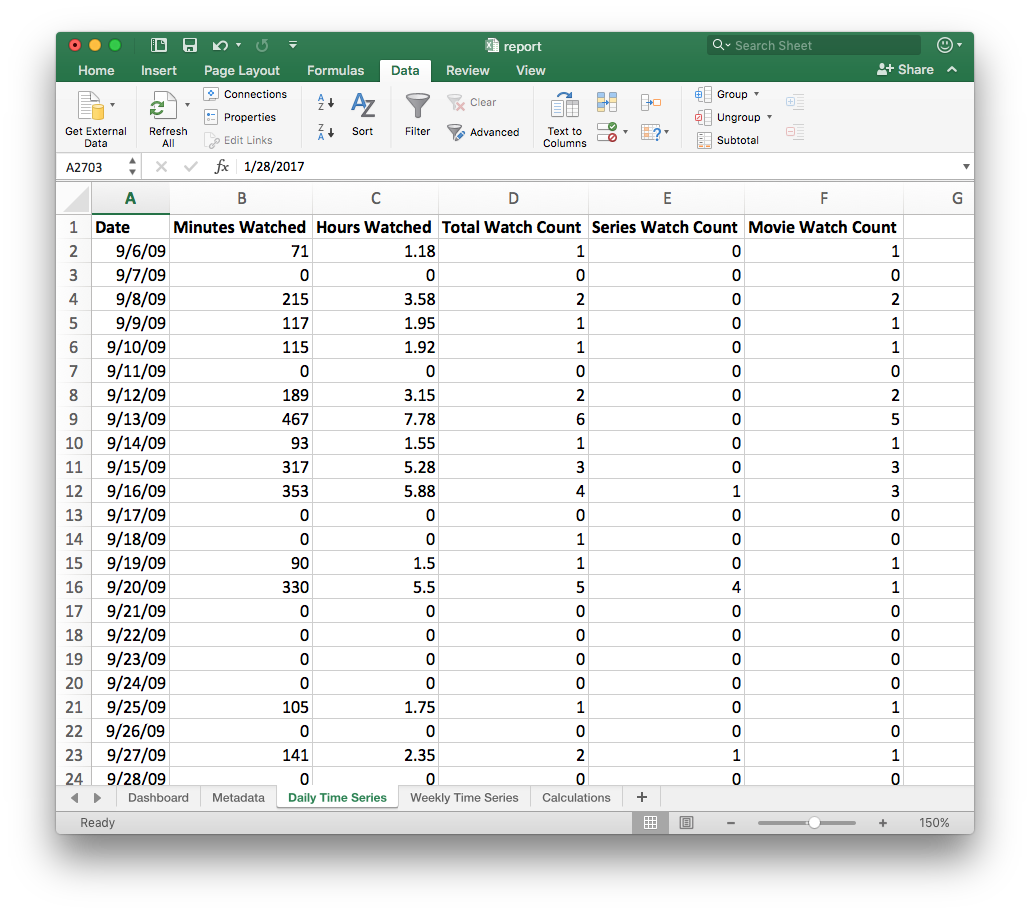
Time Series: I have a great time series dataset, showing me minutes, hours, number of shows, and number of movies watched for every single day starting in 2009 when I became a Netflix member.
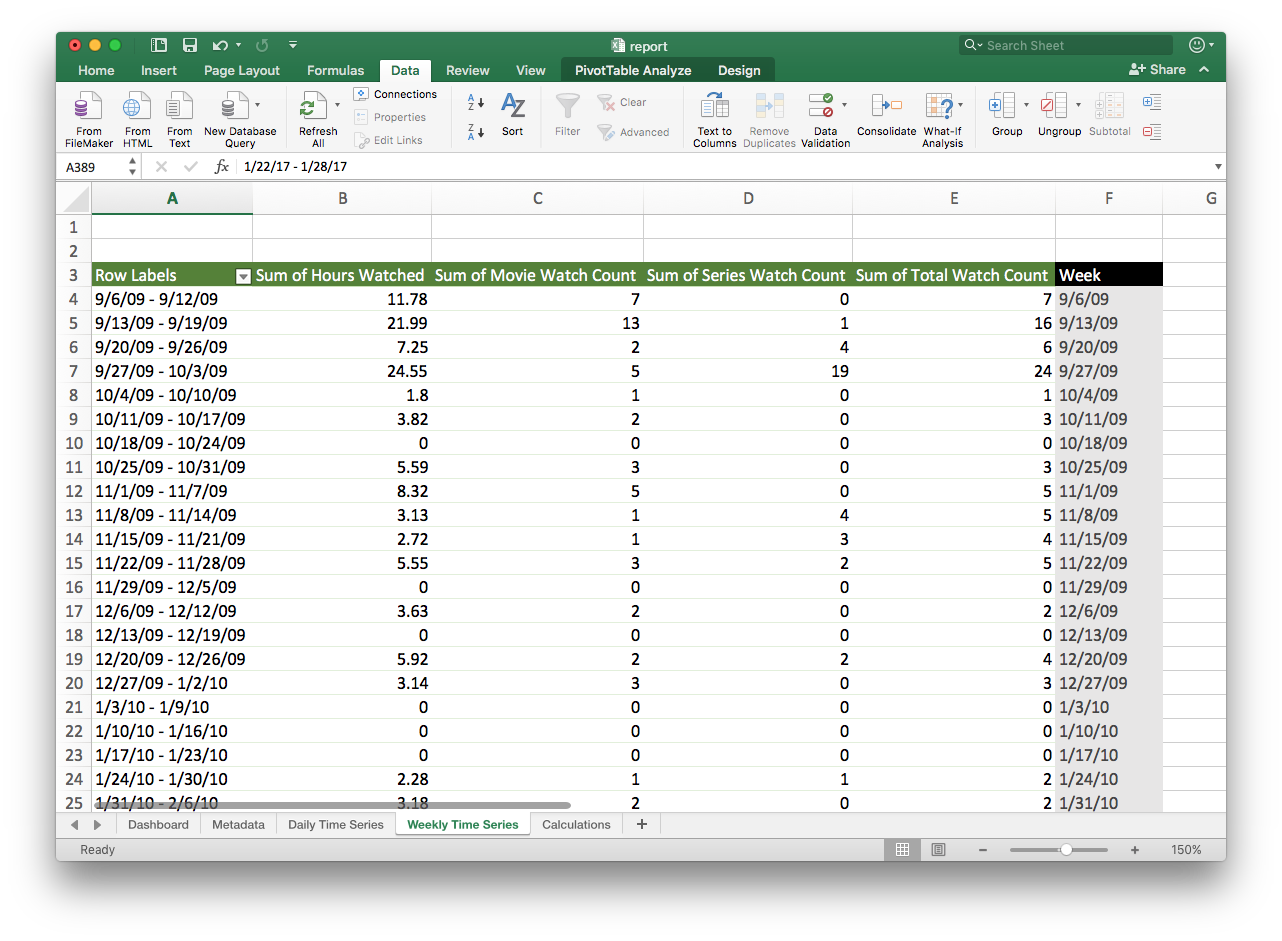
Weekly Time Series: Daily time frames have a lot of peaks and valleys, so I wanted to look at all of the dates from a weekly perspective. Using a Pivot Table, I could easily make that happen without in seconds
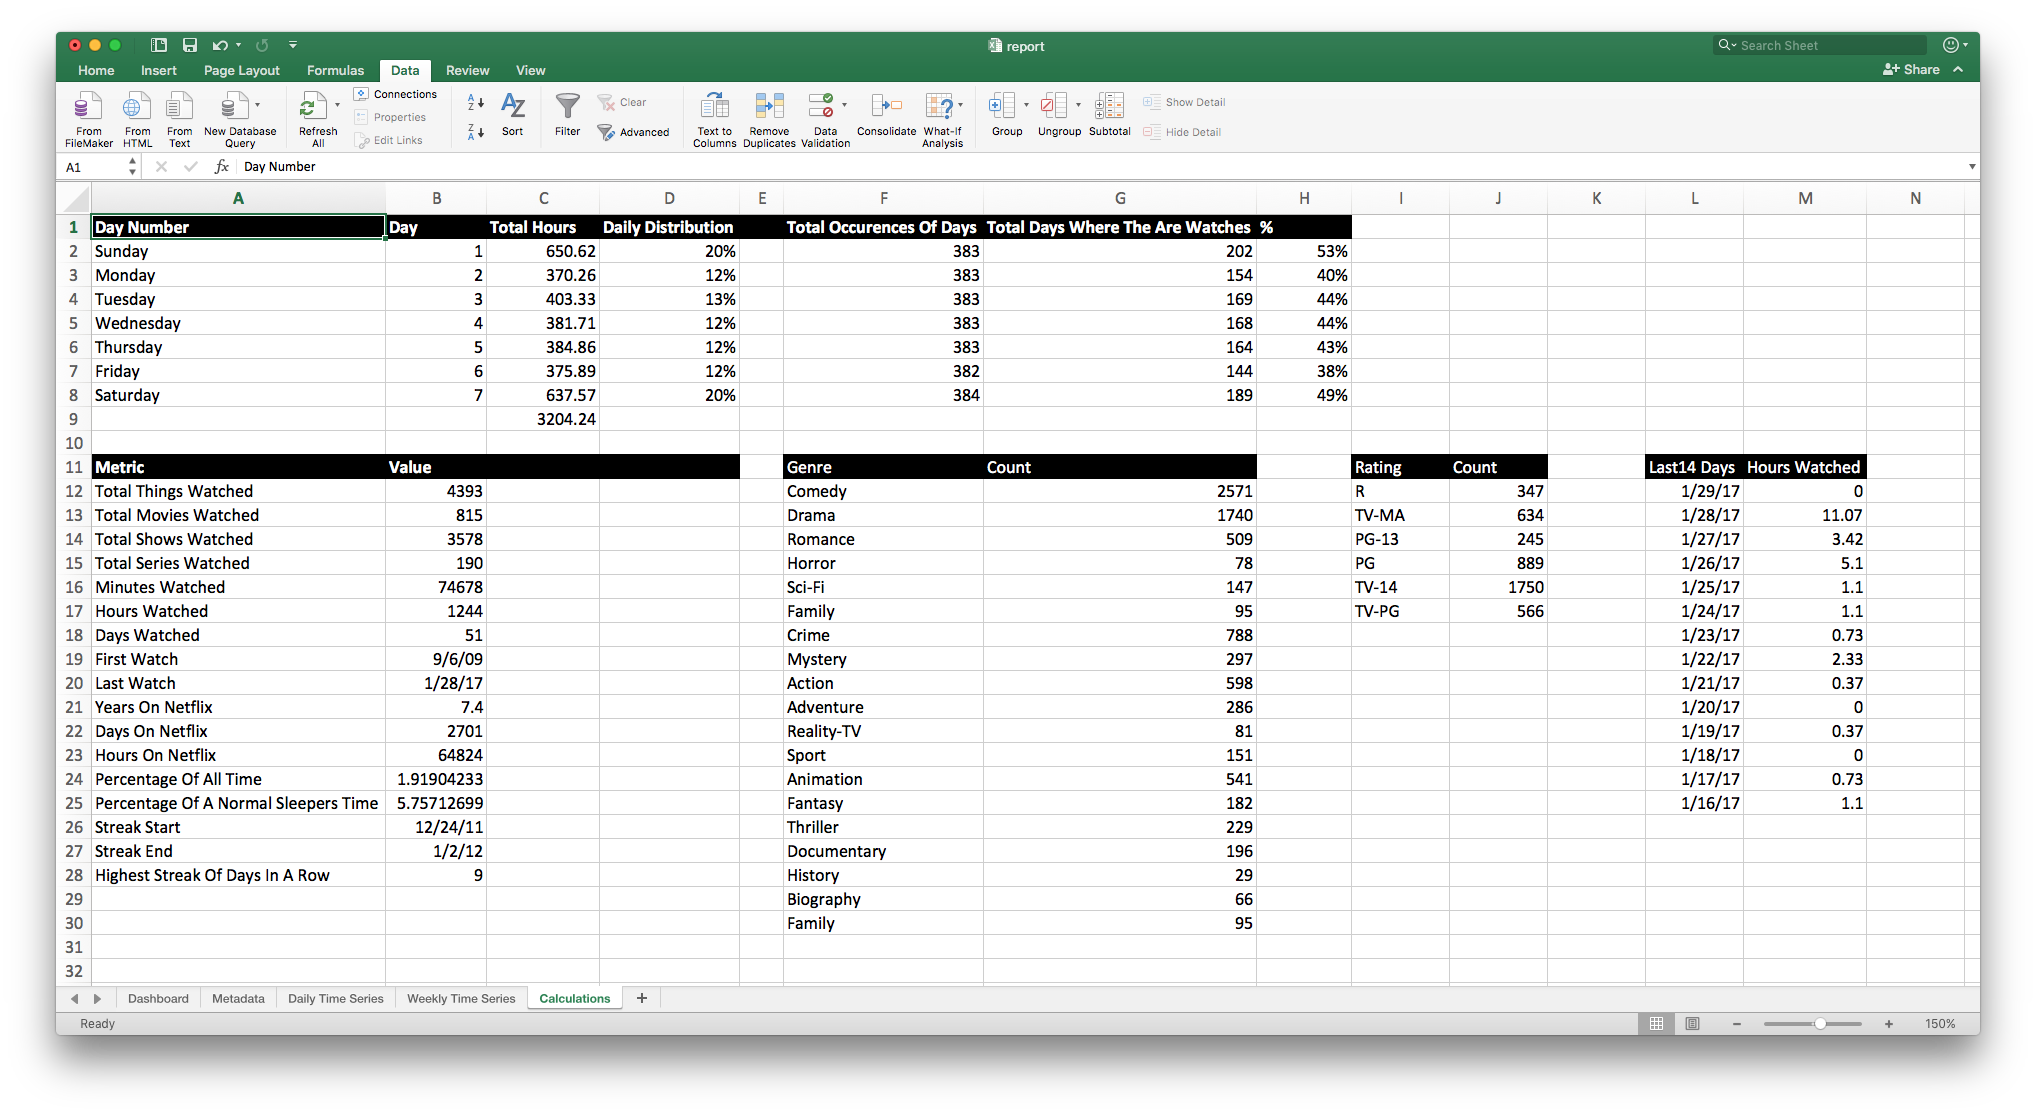
Metrics: There are some simple metrics that I wrote programatically, but I also wanted to do some counting on genres, ratings, and more. Excel to the rescue again. With a few simple queries, I have all of the information I need.
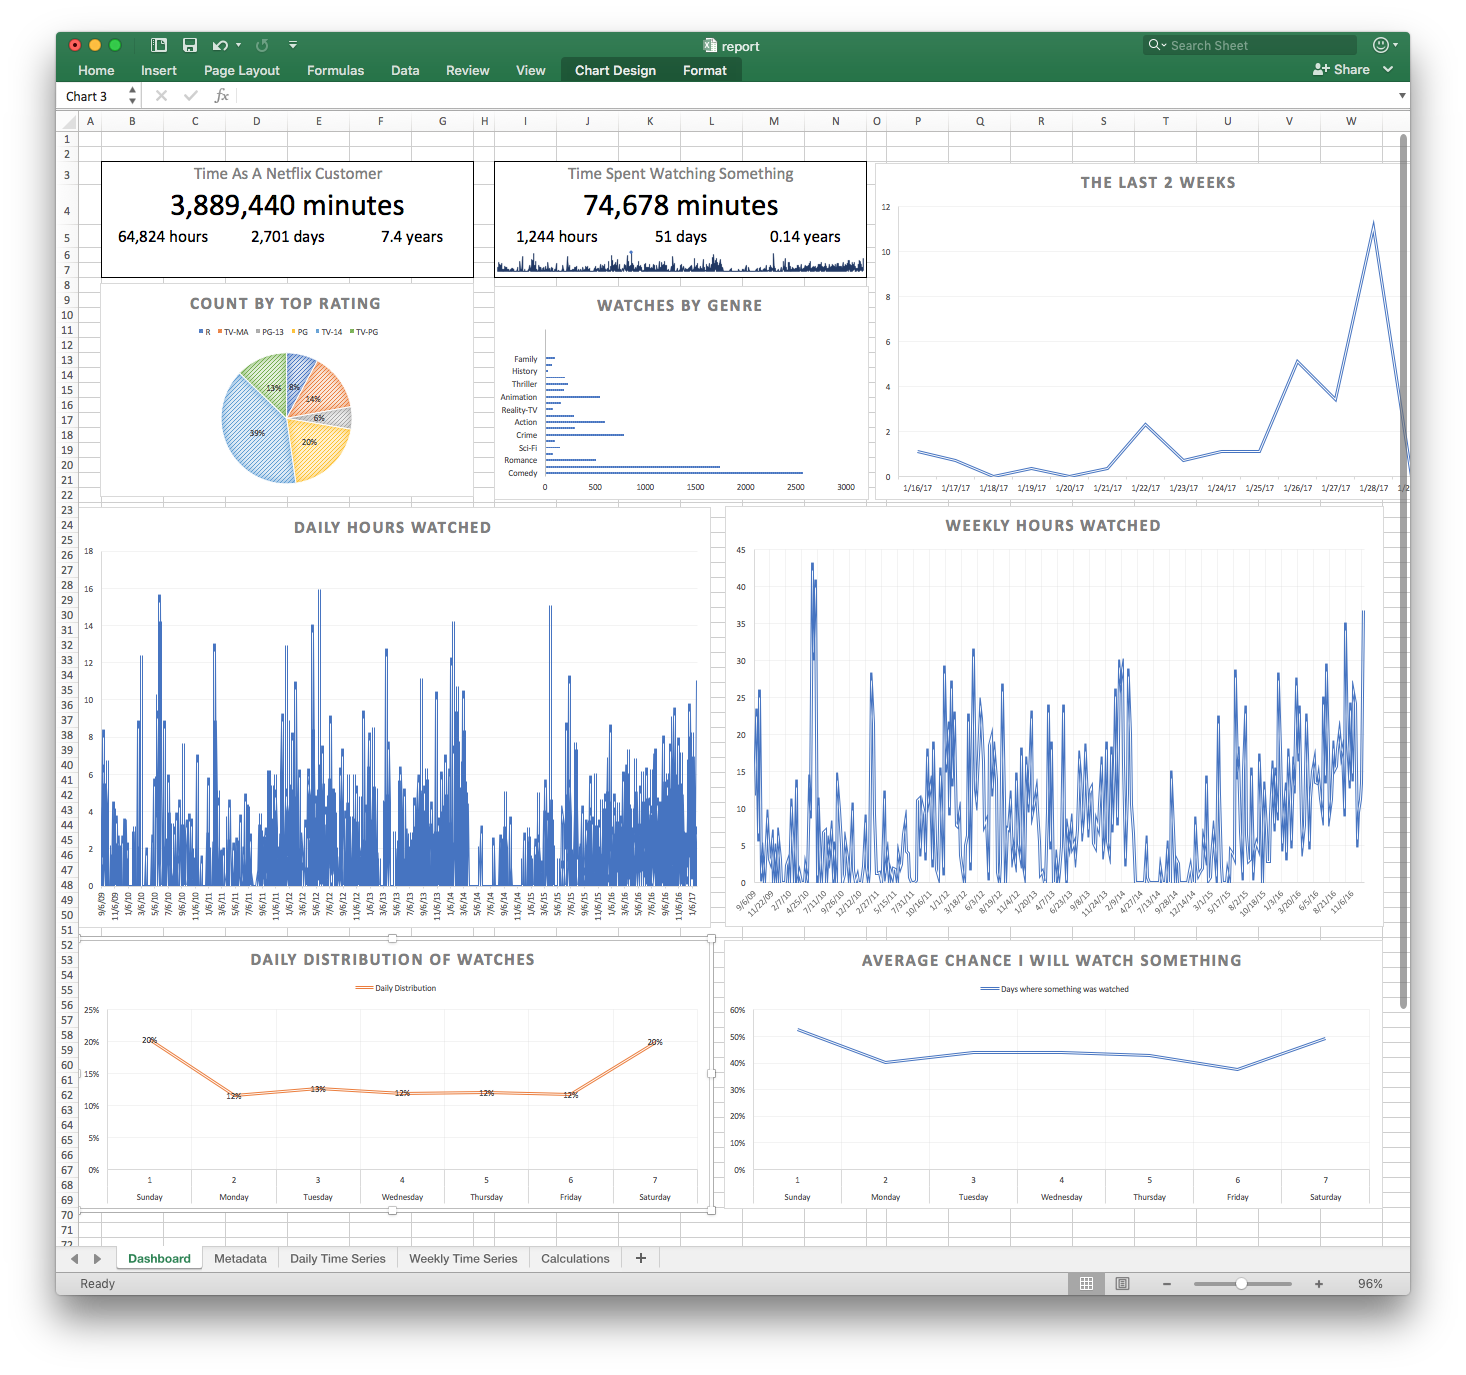
Final Report: With everything in place, I finally have a straight forward and easy to process report of all of my viewing activity. With all of this information in Excel, I can easily dive deeper or process the data however I want.
Reflection
I can quit anytime I want…I just do want to.
As a whole, this information doesn’t make me want to watch less Netflix, it’s not as if it interferes with my family time or work. It’s something I do when everyone is asleep and I’m plugging away on emails, client work, etc.
I started this program because I am always on the lookout for ways to better understand personal data through simple web scraping and processing. Ironically, I watched 7 hours of Netflix movies while writing this script and 3 hours of tv shows while writing this article.
The Code
The code is on Github at https://github.com/timjuravich/netflix-viewing-history and free to use.